SCOPAC Storm Analysis Study
Dr Matthew Wadey, Bournemouth Christchurch and Poole (BCP) Council, Dr Ivan Haigh and Addina Inayatillah, University of Southampton and Emily Last, Coastal Partners: £25,000 (2018-2020)
Introduction
This excellent piece of research was commissioned following a SCOPAC meeting in January 2017, where officers and members noted yet another challenging start to the winter in terms of beach losses and asset failures.
We know sea levels are rising but the big question is whether storm magnitude and frequency are also increasing, signifying a climate change influence?
The key findings suggest that the central south coast of England could indeed be experiencing a trend of increased storminess in the form of increased wave height, wave period (wave power) and bi-modal seas since 2003, confirming the impacts felt by coastal managers on the ground. The results make a case for ongoing and enhanced investment into flood and coastal erosion risk management. To what extent this trend will continue will be monitored closely over the coming years and we hope to attract funding to investigate the significance of these findings further.
Background
Coastal floods are a major global hazard leading to long-lasting and wide-ranging social, economic and environmental consequences. With sea-level rise accelerating, and possible changes in storminess, high sea levels will occur more frequently in the future.
The UK has a long history of severe coastal flooding, and at present 2.5 million properties and £150 billion of assets are potentially exposed to coastal flooding. More than 24,000 properties across the SCOPAC are currently exposed to a 1 in 200-year coastal flood. More than half of this exposure is in Portsmouth, which after London and Hull contains the most properties exposed to coastal flooding for any city in the UK. Some of the largest increases in flood risk in England and Wales are predicted to occur along the SCOPAC coastline over the 21st century. Over the next decade more than £150 million will be spent on upgrading flood defences in Portsmouth alone.
Proposal
In response to recent extreme events and stormy winters (e.g. 2013/14 and 2015/16), BCP Council led on an analysis across the SCOPAC region, comparing extreme events and winters using sea level and wave data sets. The aim was to put recent events into context with longer data sets, providing easily accessible and understandable scientific information that can be used to infer causes of coastal flooding and/or erosion. The data sets utilised were mainly from the Regional Monitoring Programme / Channel Coastal Observatory (CCO) and the National Tide and Sea Level Facility (NTSLF) (Figure 1).

Figure 1: CCO wave buoys and NTSLF tide gauges
Summary of findings
Prompted by concerns over climate change and recent stormy winters, in particular that of 2013/14 (W2013/14), this study assesses sea level and wave data along the south coast of the UK to determine context and extremity of events and winters within the spans of these data sets. These data are available as 15-30 minutely spaced time series since the early 20th century for sea level and since 2003 for waves. In terms of the conceptual flood system known as the “source-pathway-receptor-consequence” model, this study focuses upon coastal flood “sources”. “Consequences” are briefly reviewed to extend the context but future focus on the other components is recommended.
This formulation of regional and local scale results within the SCOPAC region is quite unique amongst other studies and gives up to date guidance on possible indicators of climate change and winter extremities for a range of audiences (coastal practitioners, academics, politicians).
Trends and Patterns
In terms of TRENDS AND PATTERNS, 9 sea level (tide gauge) sites were assessed across the English Channel. At all sites, mean sea level is rising and the rate of rise has accelerated in recent years – this is the most certain finding to take from this analysis. The most reliable long-term rate relevant to the English Channel (and the SCOPAC region) at Newlyn indicates a rise in mean sea level of 1.86 mm/yr. between 1915 and 2019, increasing to 3.8 mm/yr. between 1990 and 2019. The analysis suggests changes to tidal characteristics such as mean high water and tidal range, although as yet with no consistent spatial trend evident across the region. Statistically significant increases in storm surges are not found, consistent with findings from other parts of the world.
All the 9 wave buoy sites (except the furthest east, Folkestone) have an increasing trend in wave height. There is a signal that wave period has increased at most sites but with trends that are not statistically significant due to the short data span (2003 onwards) – hence the exceedance analysis in the next section is pertinent to understand this. Combining wave height and period into a wave power (indicative of the energy dispensed onto the shoreline) and run up (indicative of overtopping or flood potential), there is an upward trend with time (the report explains how the statistical significance varies). The W2013/14 had notably higher wave power across all sites. Combining waves and sea level into time series of total water level suggests a statistically significant annual increase for the Solent and eastern SCOPAC region across the entirety of the datasets, with the W2013/14 an outlier for clustering and extremes.
Threshold Exceedances
Events (peaks in the respective data) were assessed against known limits (e.g. return periods) to count THRESHOLD EXCEEDANCES from 2003-2019 at four “site pairings” (sea level and wave recording sites), as follows: (1) Weymouth-Chesil; (2) Poole Bay, (3) The Solent and (4) Newhaven-Rustington. A consistent statistical trend cannot be found, mostly likely because of the relatively short data lengths. However, comparing winters since 2003 highlights how recent years have seen growing “clusters” of extreme events: in the western-central SCOPAC area, W2013/14 definitively produced the highest count of extreme sea level and wave height events; in the east SCOPAC region W2013/14 and W2015/16 were comparably extreme.
Storm Events and Extremes
In terms of STORM EVENTS AND EXTREMES from the four site pairings, in the west of the region W2013/14 recorded the highest surge, wave height, wave run-up, and most powerful waves (all on the 14th February 2014 “Valentines Storm”) since 2003. In the west and central SCOPAC area, the highest water level was on 10th March 2008 although with missing sea level data at Bournemouth considered, the 2014 Valentines Storm is probably the most extreme event in terms of physical loading upon coastal defences and flood potential. The 6th January 2014 is also noteworthy for the prolonged, region-wide, high wave run up and power. In the Solent: W2013/14 had the highest sea level event since 1961 (on the 5th-6th December 2013 when a North Sea surge propagated from the east during calm wave conditions in the Channel). Meanwhile the 5th February 2014 and 14th February 2014 produced the most powerful waves and highest run up since the records began in 2003. The highest waves on record in the eastern part of the region were on the 24th December 2013. The highest total water levels were more recently during Storm Eleanor in January 2018. Again, this is indicative of the past recent decade containing more extreme events than other comparable intervals of time during the past half century.
Bimodal Waves and Swell
The next area of investigation was into BIMODAL WAVES AND SWELL. Such conditions are generally considered as unusual and energetic wave conditions that can cause more damage at the coast. For each winter season, this part of the analysis highlighted that the W2013/14 and W2015/16 stand out as the most bimodal since data sets began in 2003; with Jan-Feb 2014 and Dec-2015 being the most extreme months. It seems given events that overlap with these months, that persistent bimodal wave activity could be, as previous studies have alluded to, directly linked to beach drawdown and structural failures. A linear trend through the data suggests the possibility of increasingly bimodal seas over time – further work is needed to assess the cause and nature of this at a regional and local scale, since these findings are consistent with broader scale global studies that suggest a climate change link.
Consequences
A brief look at CONSEQUENCES was the final step to provide a broader historical perspective including examining events before good quality sea level and wave data sets are available. This is using a longer systematically assessed ‘qualitative’ data set. We found evidence of 187 distinct coastal flood events within the SCOPAC region in a 318-year period from 1703 to present. This again highlights that W2013/14 has seen the most events of any season in this data set (although availability recently of data may bias this). However, it also highlights the role of modern risk management because W2013/14 does not even rank in the top 10 winters for the most severe flooding (even though it is possible that it was the most extreme winter from a waves and sea level perspective). The most severe coastal flood events occurred on 15th January 1918, 13th December 1989, 26th November 1954, 26th December 1912 and 1st January 1877. It is possible that an event in November 1824 was the most severe in every regard (sources to consequences) but a lack of information means this cannot be verified. Further studies should continue to monitor events and winters in context with the ongoing data sets, and take the opportunity to extend the wave data analysis back further in time from numerical model hindcasts.

Coastal storms: detailed analysis of observed sea level and wave events in the SCOPAC region (southern England)
Download the Technical Report (PDF, 17Mb)
Project outputs and deliverables
- A technical report has been produced describing the method and findings (above);
- A presentation on the outcomes of the research project was given at the first SCG/SCOPAC Conference in January 2021; the online Conference was attended by members of the SCG, SCOPAC, the Southern Regional Flood and Coastal Committee (RFCC) and the Wessex RFCC. The presentation is available at Microsoft PowerPoint Online (Google Drive);
- The key findings have been distilled into an infographic (below) Download the Infographic (low resolution PDF, 5Mb)
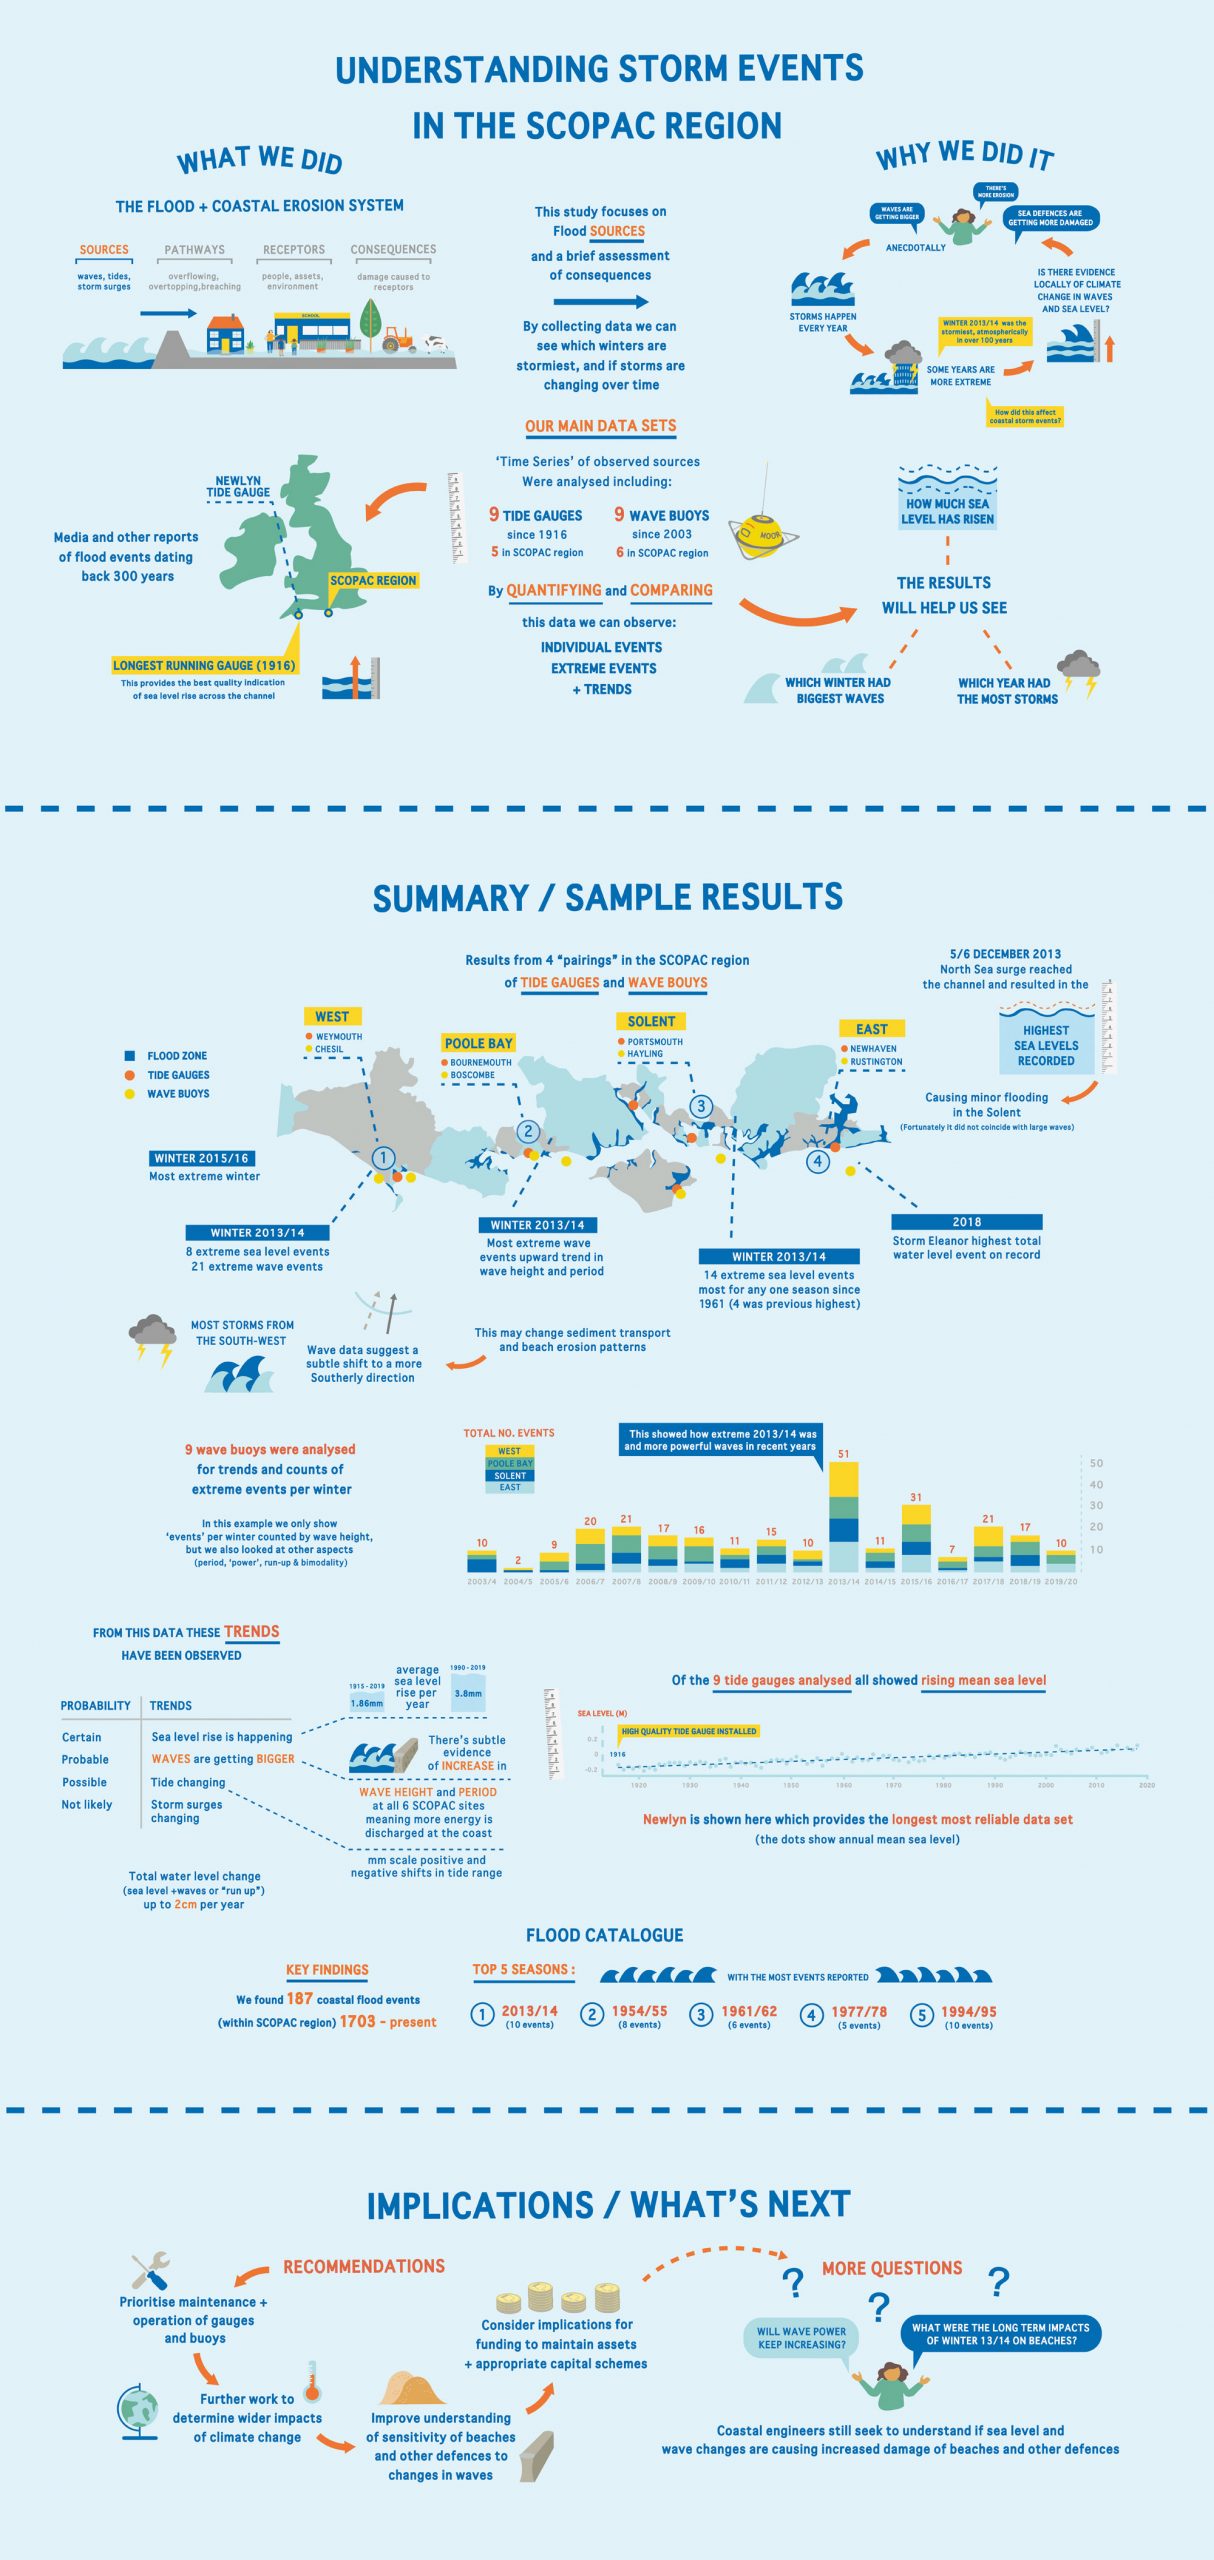
Download the Infographic (low resolution PDF, 5Mb )